
Introduction
Smart light poles are no longer just public lighting assets; they are becoming modular urban platforms that can host sensors, connectivity equipment, EV charging, and digital advertising. This shift changes the business logic from a purely municipal expense to a mixed revenue model built on data services and commercial use of roadside space. Understanding how operators monetize these poles requires looking at both the technical functions they provide and the market demand they serve. The following section explains the main operating model, the revenue channels involved, and why profitability depends on combining infrastructure efficiency with targeted commercial partnerships.
Smart Light Pole Business Model
The transition from traditional municipal lighting to intelligent infrastructure represents a fundamental shift in urban asset management. Rather than operating as pure cost centers, smart street lighting networks now function as decentralized digital hubs capable of generating multifaceted revenue streams while reducing overall municipal energy expenditures.
Definition and multifunction value
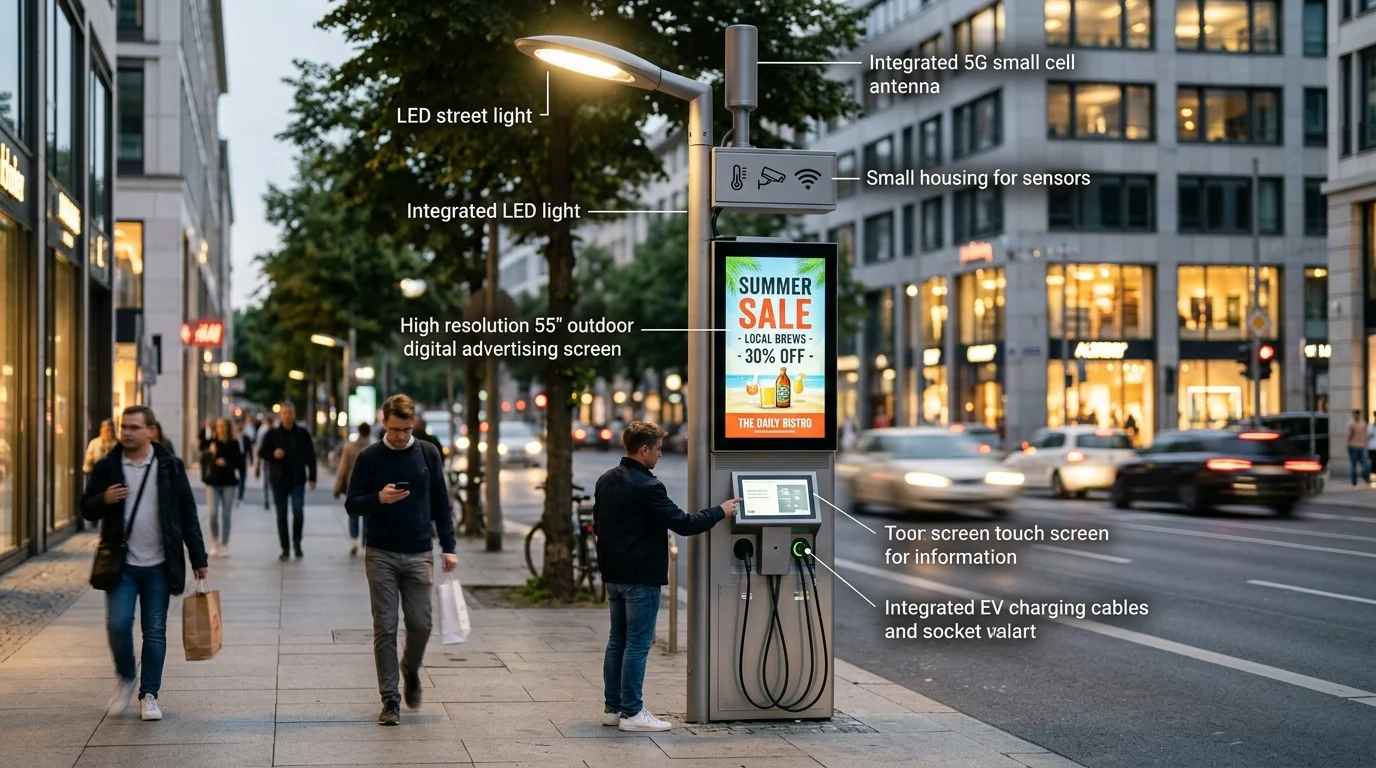
At its core, a commercialized intelligent lighting network integrates modular hardware components designed to serve distinct municipal and commercial functions. Beyond standard LED illumination, these structures act as vertical real estate housing 5G micro-base stations, high-resolution digital out-of-home (DOOH) advertising screens, electric vehicle (EV) charging interfaces, environmental sensors, and edge computing nodes.
This multifunctionality significantly alters the capital expenditure (CapEx) profile. While a standard municipal street light may cost under $2,000 to install, a fully equipped intelligent unit commands an initial investment ranging from $15,000 to $25,000. Justifying this premium requires operators to leverage the integrated technology stack to extract continuous commercial value from the surrounding urban ecosystem.
Market drivers and demand
The proliferation of these advanced networks is primarily driven by the intersecting demands of telecom densification and smart city digitalization. As mobile network operators (MNOs) deploy high-frequency millimeter-wave (mmWave) 5G networks, the necessity for densely packed, powered, and fiber-connected vertical assets has surged, making existing street lighting infrastructure the ideal host.
Simultaneously, municipal mandates for energy efficiency and data-driven governance accelerate adoption. Industry forecasts indicate the global market for this infrastructure will expand at a compound annual growth rate (CAGR) exceeding 21%, potentially reaching $14.5 billion by 2028. This growth trajectory is heavily reliant on public-private partnerships (PPPs) that shift the financial burden from municipal budgets to specialized commercial operators.
Revenue Streams
Transitioning a high-CapEx infrastructure network into a profitable enterprise requires aggregating multiple distinct revenue streams. Operators must balance long-term, stable infrastructure leasing with dynamic, high-margin commercial services.
Advertising, connectivity, and data services
The primary engines of profitability within this ecosystem are digital advertising, telecom connectivity, and localized data monetization. High-definition LED displays mounted at pedestrian eye level command premium DOOH advertising rates, particularly because they can deliver dynamically targeted content based on the time of day or local foot traffic.
Concurrently, leasing vertical space and fiber backhaul to MNOs for 5G micro-cells provides predictable, recurring revenue. In dense urban markets, operators can secure lease rates of $1,200 to $2,500 annually per pole from a single telecom provider. Furthermore, integrated sensors capture granular urban data—such as hyper-local weather patterns, traffic flow, and air quality metrics—which can be anonymized and sold via API to logistics companies, real estate developers, and mapping services.
Comparing monetization models
Understanding the financial characteristics of each monetization channel is critical for forecasting return on investment. Operators must continuously evaluate the trade-offs between initial hardware costs and the anticipated revenue frequency.
| Revenue Channel | CapEx Impact | Gross Margin Potential | Revenue Frequency | Primary Client Base |
|---|---|---|---|---|
| DOOH Advertising | High (LED screens) | 60% – 80% | Variable / Campaign-based | Media buyers, local retail |
| Telecom Leasing | Medium (Mounts/Fiber) | 70% – 90% | Fixed Annual/Monthly | MNOs, ISP providers |
| EV Charging | High (Power inverters) | 15% – 30% | Transactional | Individual consumers |
| Data Services | Low (Sensors/APIs) | 80%+ | Subscription-based | Logistics, municipalities |
By layering these models, operators can cross-subsidize lower-margin, high-utility functions like EV charging with the high-margin yields of telecom leasing and targeted digital advertising.
Execution and Risk Control
Despite the lucrative potential, deploying advanced urban infrastructure involves complex logistical, regulatory, and financial hurdles. Robust execution frameworks and stringent risk control mechanisms are non-negotiable for sustaining profitability and ensuring operational longevity.
Site selection and deployment steps
The commercial viability of any deployment is intrinsically linked to geospatial positioning. Site selection protocols must prioritize high-density commercial zones, transit hubs, and entertainment districts. For DOOH advertising to be highly profitable, operators typically target locations with a minimum daily footfall of 30,000 to 50,000 pedestrians.
The deployment phase itself requires navigating fragmented municipal bureaucracies to secure right-of-way access, electrical grid upgrades, and fiber trenching permits. Phased rollouts are recommended, establishing a profitable anchor network in premium downtown corridors before expanding into secondary residential zones where telecom leasing will likely serve as the sole revenue driver.
Investment decisions and risk criteria
Financial modeling for these networks generally projects payback periods ranging from 4 to 7 years, heavily dependent on the local regulatory environment and the operator’s ability to secure anchor tenants prior to installation. Risk criteria must account for rapid hardware obsolescence, particularly regarding edge computing processors and display technologies.
Furthermore, operators face significant physical and digital vulnerabilities. Vandalism, vehicular accidents, and extreme weather necessitate comprehensive insurance and rapid maintenance protocols. On the digital front, operators must guarantee stringent cybersecurity measures to protect aggregated municipal data and ensure a service-level agreement (SLA) uptime of at least 99.9% to satisfy strict telecom and advertising contracts.
Key Takeaways
- The most important conclusions and rationale for the commercial operation model of Smart Light Poles: How to Achieve Profitability Through Data and Advertising
- Specs, compliance, and risk checks worth validating before you commit
- Practical next steps and caveats readers can apply immediately
Frequently Asked Questions
What makes a smart light pole commercially profitable?
It combines multiple revenue sources—DOOH ads, telecom leasing, data services, and EV charging—so the pole earns beyond lighting and helps offset higher upfront costs.
Which revenue stream is usually the most stable?
Telecom leasing is often the most stable because it can bring fixed monthly or annual income from 5G micro-cell hosts and fiber backhaul access.
How can data from smart poles be monetized?
Sensors can collect traffic, weather, and air-quality data, then anonymize and sell it through APIs to logistics firms, municipalities, and mapping providers.
Where should smart light poles be deployed for better returns?
Focus on high-footfall areas such as transit hubs, commercial streets, and entertainment districts, especially locations with 30,000 to 50,000 pedestrians per day.
How can Morelux support smart pole projects?
Morelux provides customized pole solutions, technical drawings, engineer support, fast quotes, and dependable manufacturing for infrastructure buyers and project teams.