
Introduction
Cities can no longer rely on a handful of fixed monitoring stations to understand how pollution changes block by block. An air quality sensor pole network uses street-level infrastructure to collect continuous, localized data, revealing patterns that conventional stations often miss. This article explains how these pole-mounted systems improve urban pollution mapping, what technologies make them practical at scale, and why cities are adopting them for planning, compliance, and public health decisions. It also sets up the key tradeoffs around accuracy, coverage, connectivity, and maintenance that shape successful deployments.
Why Air Quality Sensor Pole Networks Matter
The transition from sparse, high-cost reference stations to dense, localized monitoring networks represents a fundamental paradigm shift in urban environmental management. An air quality sensor pole network leverages existing municipal infrastructure to deploy compact, continuous monitoring devices, creating high-resolution pollution maps. By integrating Internet of Things (IoT) connectivity with advanced metrology, these networks empower cities to move beyond reactive compliance reporting toward proactive, data-driven air quality interventions.
How deployments support urban air monitoring
Traditional Federal Reference Method (FRM) or Federal Equivalent Method (FEM) stations provide exceptional analytical accuracy but suffer from extreme spatial sparsity, often representing air quality over radii of 10 to 50 kilometers. Deploying an air quality sensor pole network closes this critical gap by establishing an observational grid with spatial resolutions as tight as 500 meters to 1 kilometer. This hyper-local data enables municipal authorities to identify micro-environments, track diurnal pollution patterns at the street level, and distinguish between neighborhood-level emission sources that sparse networks and generalized dispersion models routinely overlook.
What market and policy forces drive adoption
Regulatory pressures and evolving public health standards act as the primary catalysts for network expansion. The World Health Organization’s 2021 revision of air quality guidelines, which lowered the recommended annual mean for PM2.5 from 10 µg/m³ to 5 µg/m³, forces cities to monitor particulate matter with unprecedented spatial granularity. Furthermore, smart city initiatives and federal infrastructure grants increasingly tie funding to data-driven environmental justice metrics. This compels local governments to invest in scalable, pole-mounted sensor architectures that not only demonstrate regulatory compliance but also guide targeted traffic and industrial interventions.
What Makes a High-Performance Air Quality Sensor Pole
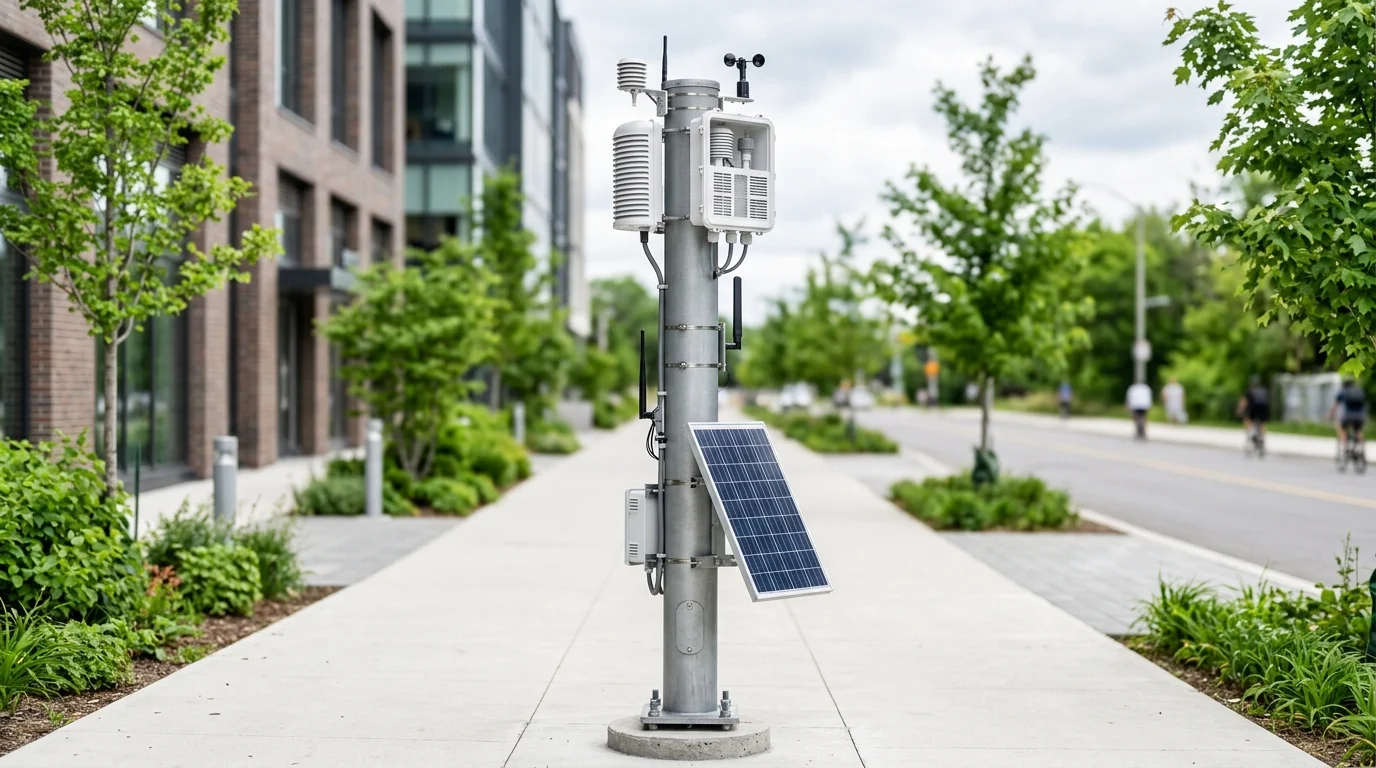
A robust air quality sensor pole integrates advanced metrology, resilient communications, and ruggedized enclosures into a single deployable asset. High-performance models must carefully balance the physical constraints of pole-mounting—such as weight limits, wind shear, and power availability—with the absolute necessity for analytical precision and long-term stability.
Which pollutants and environmental variables to measure
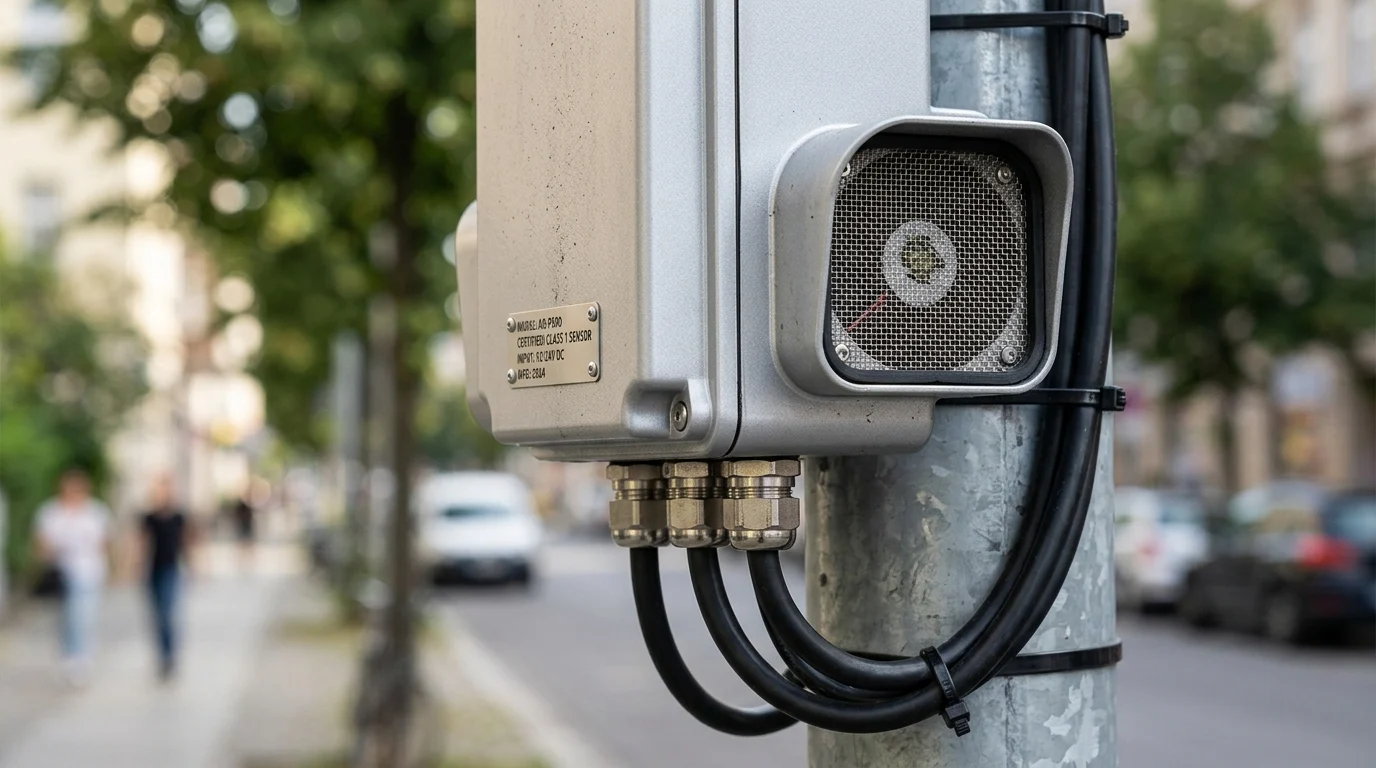
Comprehensive environmental mapping requires the simultaneous quantification of particulate matter fractions (PM1.0, PM2.5, and PM10) alongside gaseous criteria pollutants (NO₂, O₃, CO, and SO₂). Advanced sensor poles must also integrate meteorological variables, including ambient temperature, relative humidity, and barometric pressure, which are critical for correcting gas sensor cross-sensitivities and understanding localized pollution dispersion.
| Parameter | Typical Sensor Technology | Standard Detection Range | Target Resolution |
|---|---|---|---|
| PM2.5 | Optical Particle Counter (OPC) | 0 – 1,000 µg/m³ | 1 µg/m³ |
| NO₂ | Electrochemical | 0 – 5,000 ppb | 1 ppb |
| O3 | Electrochemical / Metal Oxide | 0 – 5,000 ppb | 1 ppb |
| Temp/RH | Solid State / Capacitive | -40°C to +85°C / 0-100% | 0.1°C / 1% |
How accuracy, calibration, and power design affect performance
Hardware performance hinges entirely on the interplay between sensor accuracy, algorithmic calibration protocols, and power management. Optical and electrochemical sensors require rigorous compensation for temperature and humidity artifacts. High-tier poles utilize machine learning models trained via co-location with FEM stations to achieve an R² correlation of 0.80 or higher in field conditions. Power design is equally critical; while grid-tied poles can support heated inlets to eliminate moisture interference, solar-powered variants must operate within strict 5W to 15W continuous power budgets, necessitating low-power wide-area network (LPWAN) radios and intelligent duty cycling.
How fixed and mobile sensor poles compare
While fixed sensor poles provide continuous, longitudinal baseline data across a stable spatial grid, mobile sensor poles—often temporarily strapped to transit infrastructure or fleet vehicles—offer dynamic spatial profiling. Fixed municipal architectures excel in establishing long-term exposure trends and verifying regulatory compliance. Conversely, mobile or temporary pole deployments are highly effective for rapid hotspot identification, emergency response, and short-term investigative studies. A hybridized network approach utilizes fixed poles as highly stable calibration anchors for mobile units traversing the urban environment.
How to Design and Scale an Air Quality Sensor Pole
Transitioning from individual sensors to a cohesive urban network requires rigorous spatial planning and systematic deployment workflows. The overarching architectural goal is to achieve maximum spatial representativeness while minimizing physical infrastructure modifications and recurring maintenance overhead.
What steps are required for planning and deployment
Deployment planning begins with a comprehensive site survey to assess microclimates, the structural integrity of existing municipal assets, and communication line-of-sight. For optimal data fidelity, instruments must be mounted at a standardized breathing zone height, typically 3 to 4 meters above ground level, avoiding direct proximity to exhaust vents, dense tree canopies, or localized vibration sources. Network architects must also select appropriate telemetry—such as LTE-M, NB-IoT, or LoRaWAN—based on local coverage maps and the payload requirements dictated by 1-minute to 15-minute data transmission intervals.
How to balance hotspot and background coverage
Effective spatial design stratifies the monitoring grid to capture both peak exposures and regional baseline levels. A standard deployment ratio allocates approximately 70% of the air quality sensor poles to suspected pollution hotspots, including high-traffic intersections, industrial perimeters, and maritime ports. The remaining 30% are distributed across urban background locations, such as residential neighborhoods and municipal parks. This deliberate balance ensures that data assimilation algorithms can accurately calculate the localized pollution delta against the city-wide baseline.
What workflow supports expansion from pilot to full network
Scaling a network demands a phased workflow to mitigate technical debt and validate hardware choices. Cities typically initiate a pilot phase consisting of 10 to 25 sensor poles, deliberately co-located near existing regulatory stations for a 60 to 90-day validation period. This phase establishes the baseline calibration models and proves hardware survivability. Upon achieving the target data completeness threshold (usually exceeding 95%), the network expands geometrically to 100 or more nodes. This mass expansion relies heavily on automated provisioning tools and centralized device management platforms that handle bulk firmware updates, zero-touch provisioning, and remote diagnostics.
What Risks and Requirements Matter Most
Operating a distributed network of analytical instruments exposes municipalities to severe environmental degradation, physical tampering, and data integrity vulnerabilities. Proactive risk management and stringent hardware specifications are essential to preserve the network’s analytical value over its operational lifecycle.
How QA and drift management protect data quality
Sensor drift is the most insidious threat to data quality in low-cost networks. Electrochemical gas sensors inevitably degrade over time, typically exhibiting drift rates of 10% to 15% per annum, while optical particle counters can suffer from laser degradation and mirror fouling. Mitigating these risks requires automated quality assurance/quality control (QA/QC) pipelines. Advanced networks employ continuous over-the-air (OTA) calibration algorithms that cross-reference adjacent sensor poles and utilize baseline correction techniques to mathematically compensate for drift, reducing the frequency of physical zero-and-span checks.
What electrical, environmental, cybersecurity, and permitting risks to assess
Hardware must withstand severe environmental stressors and adhere to strict municipal codes. Enclosures must carry a minimum ingress protection rating of IP65, with structural mounts engineered to withstand wind loads up to 150 km/h. Electrically, systems tapping into municipal light poles must incorporate robust surge protection to survive grid voltage anomalies. On the digital front, transmitting municipal environmental data necessitates strict cybersecurity protocols, including AES-256 encryption for data in transit and secure boot mechanisms to prevent malicious firmware injection. Furthermore, navigating complex permitting requirements for right-of-way access can severely delay installations if not proactively managed.
What cost and maintenance factors buyers should compare
Total Cost of Ownership (TCO) extends significantly beyond the initial hardware procurement. Buyers must rigorously evaluate the long-term financial commitments associated with field maintenance, consumable parts, and data hosting.
| Lifecycle Phase | Primary Cost Drivers | Estimated % of 5-Year TCO |
|---|---|---|
| Capital Expenditure (CAPEX) | Sensor hardware, mounting brackets, solar panels | 35% – 45% |
| Deployment & Permitting | Labor, bucket trucks, right-of-way permits | 15% – 20% |
| Operating Expenditure (OPEX) | SaaS platform fees, cellular data, API access | 20% – 25% |
| Maintenance & Calibration | Replacement sensor cartridges, field tech labor | 15% – 20% |
How to Evaluate Air Quality Sensor Pole Investments
Capitalizing on urban air quality infrastructure requires rigorous vendor evaluation and a clear, quantifiable framework for measuring the socioeconomic and operational returns of the deployed network.
Which procurement criteria and vendor checks matter most
Procurement criteria must focus heavily on data transparency, hardware reliability, and vendor longevity. Decision-makers should require strict Service Level Agreements (SLAs) that guarantee at least 99.9% API uptime while demanding full municipal ownership of all raw data generated by the air quality sensor pole. Hardware warranties should cover a minimum of 24 months, with explicit, transparent terms regarding the replacement costs of consumable sensor cartridges. Additionally, buyers must verify that the vendor’s proprietary calibration algorithms are scientifically validated, ideally through peer-reviewed literature or independent third-party certification programs such as the South Coast AQMD AQ-SPEC.
How cities can measure return on investment
The return on investment (ROI) for an air quality sensor pole network is measured through both direct financial metrics and broader public health outcomes. Direct ROI includes the optimization of municipal workflows—such as implementing dynamic traffic routing to reduce congestion-related emissions—and the avoidance of federal noncompliance penalties. Indirect ROI is calculated by quantifying public health benefits, such as the reduction in asthma-related emergency room visits attributable to data-driven policy interventions. Ultimately, a well-documented pollution reduction strategy, supported by hyper-local sensor data, significantly strengthens municipal applications for lucrative federal sustainability and environmental justice grants.
Key Takeaways
- The most important conclusions and rationale for the air quality sensor pole
- Specs, compliance, and risk checks worth validating before you commit
- Practical next steps and caveats readers can apply immediately
Frequently Asked Questions
What is an air quality sensor pole used for?
It supports compact pollution and weather sensors at street level, helping cities create high-resolution air quality maps and identify local hotspots more accurately than sparse reference stations.
Which sensors are commonly mounted on an air quality sensor pole?
Typical setups include PM1.0, PM2.5, PM10, NO₂, O₃, CO, SO₂, plus temperature, humidity, and pressure sensors for correction and dispersion analysis.
How should cities choose between fixed and mobile sensor poles?
Use fixed poles for continuous baseline monitoring and compliance trends. Use mobile or temporary poles for hotspot checks, incident response, and short-term studies.
Can Morelux customize poles for air quality monitoring projects?
Yes. Morelux supports custom steel or aluminum pole solutions with technical drawings, engineer support, and manufacturing processes suited for municipal and infrastructure deployments.
What should buyers check before ordering an air quality sensor pole?
Confirm sensor load, mounting height, wind resistance, power source, corrosion protection, cable routing, and communication equipment space to match site and project requirements.